Overview
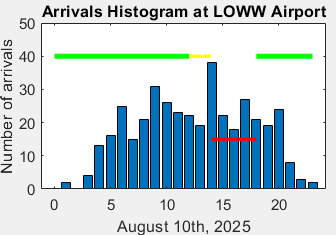
What happens when bad weather cuts an airport’s arrival capacity from 40 to 15 flights an hour for four hours? On a real day of arrivals at Vienna International Airport, we compared three ways of absorbing the shortfall: a Ground Delay Program, and two Ground Holding Programs solved by integer programming, one minimising emissions and one minimising the cost to airlines. All three caused about the same total delay, around 9,600 minutes, but shared it out very differently. Replacing seven short flights with direct trains cut the total delay by a further 6.8 %.
The scenario
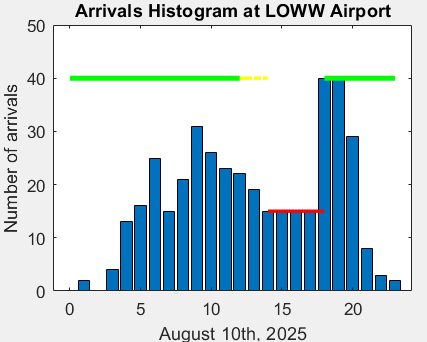
The nominal arrival capacity is 40 flights per hour, chosen from a EUROCONTROL study of airport capacity and the day’s demand. Severe weather is assumed to cut it to 15 arrivals per hour from 14:00 to 17:59. The regulation is filed at 12:40 with a 40-minute extension. Flights farther than 800 km, flights from outside the ECAC area and flights already airborne when the regulation is filed are exempt.
Ground Delay Program
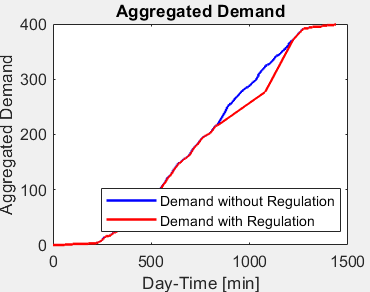
The Ground Delay Program assigns slots first come, first served: one every 4 minutes during the reduction and one every 1.5 minutes afterwards until the queue clears, at 20:19. Exempt flights get priority. Comparing each flight’s estimated arrival with its slot gives its delay, taken in the air for exempt flights and on the ground for controlled ones. We also computed the unrecoverable delay: the delay that remains if the regulation is cancelled at its start, when flights already held on the ground cannot get their time back.
For emissions, airborne delay uses a published model of fuel consumption. Ground delay is taken at 9.48 kg of CO₂ per minute with the auxiliary power unit running for delays under one hour, and 0.132 kg per minute on ground power for longer delays.
Ground Holding Programs
The Ground Holding Programs place flights in slots by solving a binary integer programme with MATLAB’s intlinprog. The variable is 1 if flight takes slot :
Each flight gets exactly one slot and each slot takes at most one flight. We used two cost functions. One counts the CO₂ of the delay, with the same model as above. The other is the cost of delay to the airlines, from the University of Westminster study published by EUROCONTROL, with separate rates for delays under and over 30 minutes, each aircraft’s seat count and an assumed turnaround of 56 minutes.
Replacing flights with rail
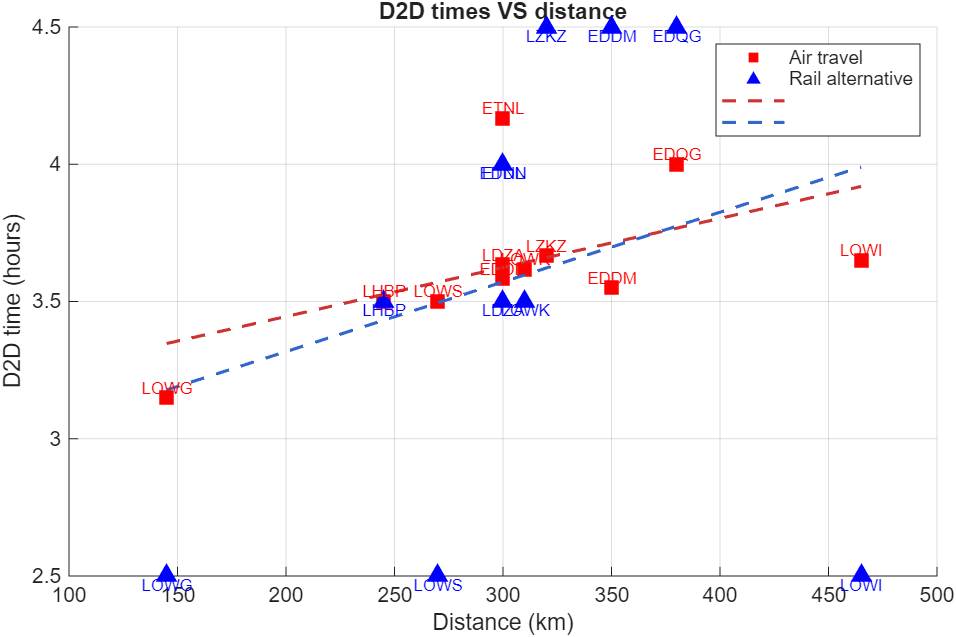
We compared door-to-door times for air and rail, adding 3 hours to the flight time and 1 hour to the train time. An LLM prompt and a MATLAB script filtered the arriving flights, and rail databases confirmed which routes had a direct train of up to seven hours: 29 routes did. Between about 200 and 400 km, rail often matched or beat air door to door.
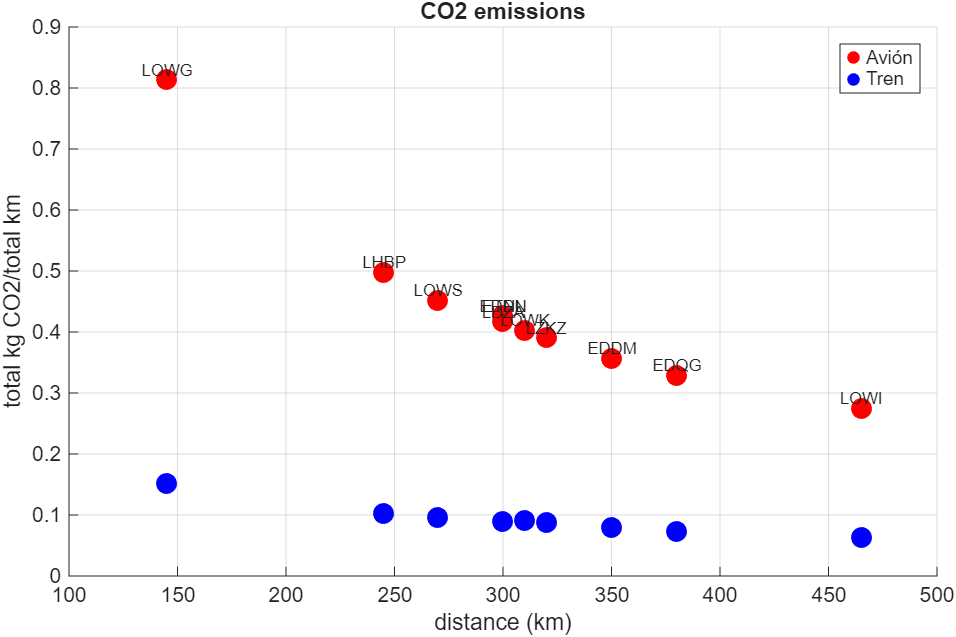
Per kilometre, the routes averaged 0.124 kg of CO₂ by air and 0.032 kg by rail, 74.2 % less.
Removing the seven substitutable flights and running the programmes again cut the total delay by 6.8 %, from 9,572 to 8,920 minutes, and the CO₂ of the delay by 6.3 %.
Results
All three programmes produced about the same totals: around 9,580 minutes of delay, of which about 8,500 on the ground and 1,100 in the air. They differed in how they spread it.
| Programme | What it improved | What it cost |
|---|---|---|
| Ground Delay Program | Most even spread of delay (lowest standard deviation) | No optimisation of emissions or cost |
| Ground Holding, emissions | About 18 % less CO₂ from delay than GDP, 34 % less than GHP for cost; highest on-time performance | Delay concentrated on a few flights; highest maximum and unrecoverable delay |
| Ground Holding, airline cost | More than €200,000 less delay cost | Uneven spread, less predictable |
In this scenario each optimised programme won on the quantity it optimised and paid for it in fairness and predictability, while the Ground Delay Program shared the delay most evenly. Airlines with few flights tended to take the largest average delays. The results also depended strongly and non-linearly on the chosen radius, filing time and capacity values.