Overview
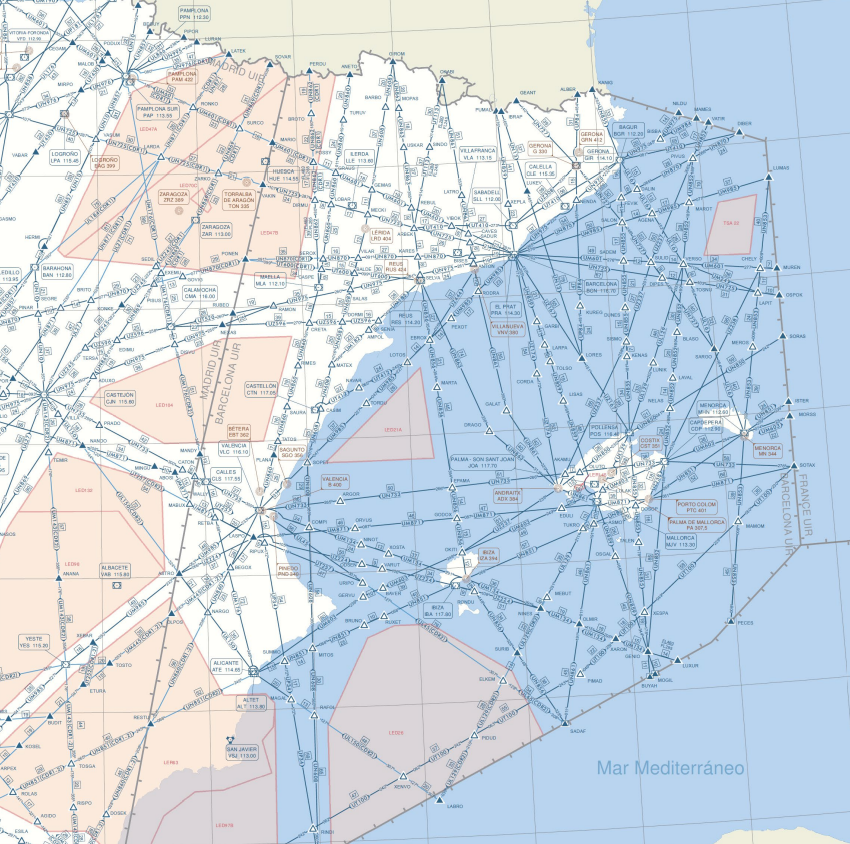
Air traffic controllers can only handle so many aircraft at once, so every sector of airspace has a declared capacity: the number of flights it can safely take in a given time. In this team project we built software that takes a full day of flight trajectories, works out exactly when each flight enters and leaves each sector, and flags the moments when a sector would receive more traffic than it can handle.
The problem in plain words
Picture the sky over a region cut into blocks, each one watched by a controller. Every flight crosses several of them on its way. If too many flights enter the same block in the same hour, that controller is overloaded, and in real operations flights have to be delayed or rerouted. Knowing in advance where and when this happens is the first step of air traffic flow management.
How it works
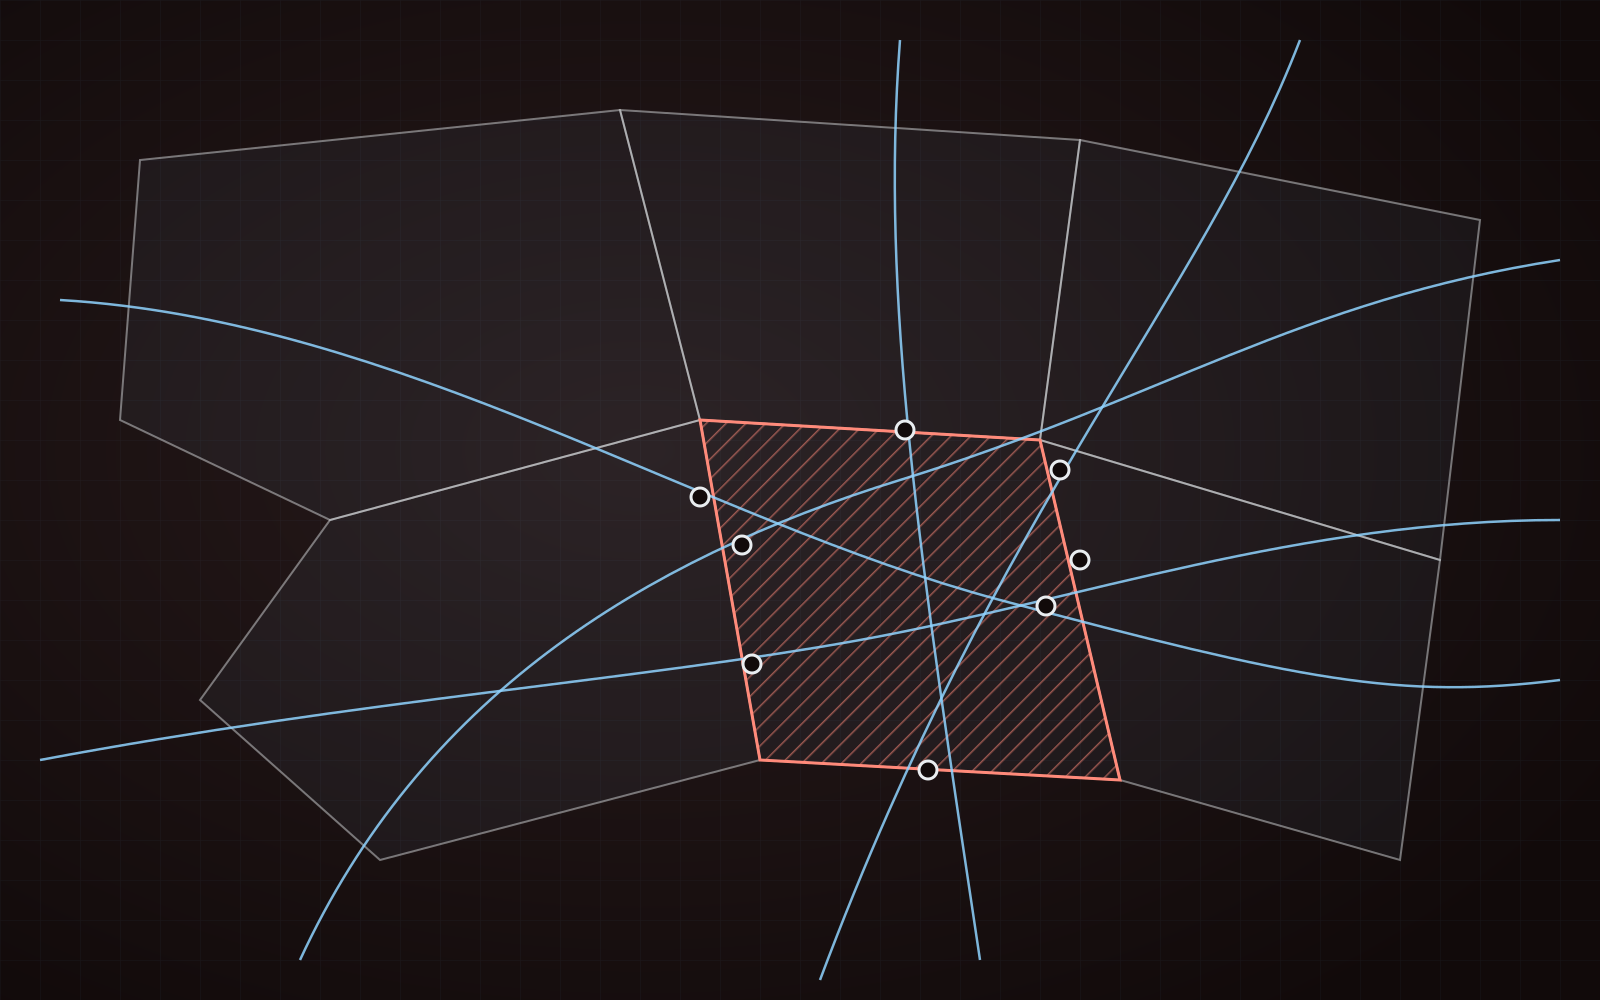
- Sectors in 3D. Each sector is a volume: one or more shapes on the map, each between a lower and an upper flight level.
- Entries and exits. For every piece of every trajectory, the program finds where it crosses each volume, horizontally and vertically, and turns the crossings into entry and exit times. Only sectors that are open at that moment count, following the day’s opening scheme, and very short crossings are filtered out.
- Demand. The entries are counted in a time window that slides through the day.
- Capacity check. Each window is marked as within capacity, close to it, or overloaded.
The calculation is a Python package, tested with pytest and developed with one Git branch per task. A local interface in the browser loads the data, runs the calculation and shows the sectors on a map with a timeline, so the overloads can be seen at a glance.